Best Picture Nominees and Ratings
31 May 2008
1:39 PM
I was talking with a co-worker at the hospital earlier this week when he mentioned that he doesn’t watch R-rated movies. Living in Utah, this isn’t surprising; many practicing Mormons shun R-rated movies based on a recommendation or commandment (opinions differ) from their president. There used to be a local video store that would edit R-rated movies and rent the bowdlerized versions, but the practice ended with a lawsuit.
I think life is basically R-rated, and movies have a lot to say about it, though there’s certainly a difference between, say, Harold & Kumar Go to White Castle and Blood Diamond. I’ve been looking for some opportunities to practice making info-graphics, so I thought I’d whip up a chart of Oscar nominees for best picture and their MPAA ratings. Even if the winners are disputed, as a group these movies are among the best made, so I thought it would be interesting to show them grouped by rating. I only covered the last 10 years, though it might be interesting to go back as far as ratings data will allow when I have more time.
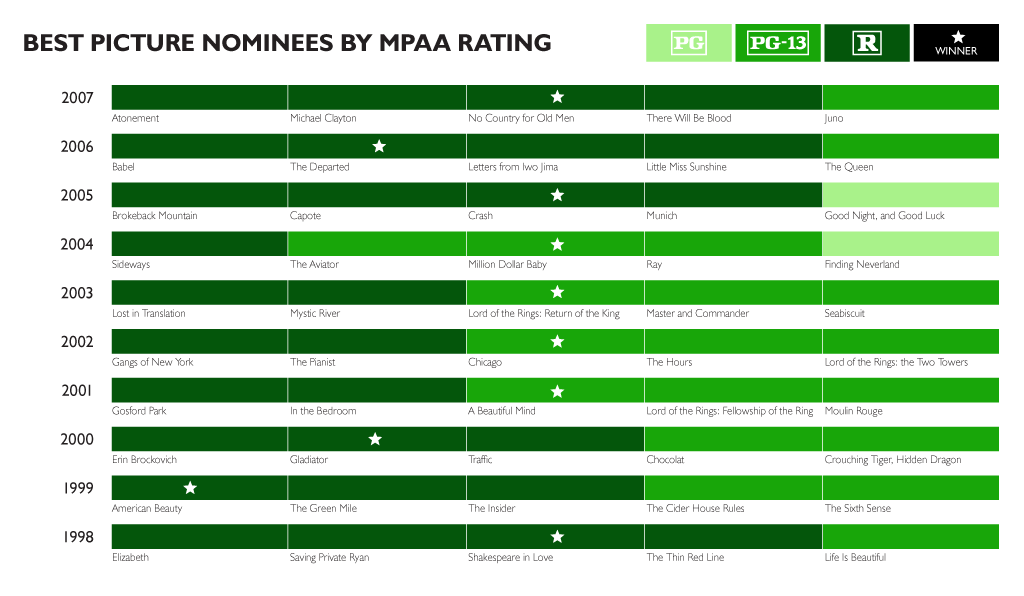
In the last decade, 29 of the nominated films were rated R (58%), 19 were PG-13 (38%), and 2 were PG (4%). Of the winners, 6 were rated R and 4 were PG-13.
You can download a PDF copy of my chart or the original data. My sources were the Wikipedia listing of nominees and the IMDB entry for each movie.
Comments